Log4j and Gflog Java Logging Libraries

Overview
Complex systems log a lot of information. Well-thought and detailed log messages can help to troubleshot severe production issues. Most systems do not have restrictions on which logging to use - synchronous or asynchronous. And yet, many high-performance systems usually prefer using asynchronous garbage-free logging to avoid hiccups on GC events and IO operations.
This article will peek under the hood of Log4j and Gflog java logging libraries and see how they are different from the memory management perspective. We will find out how things are implemented to keep allocations of new objects as low as possible.
Introduction

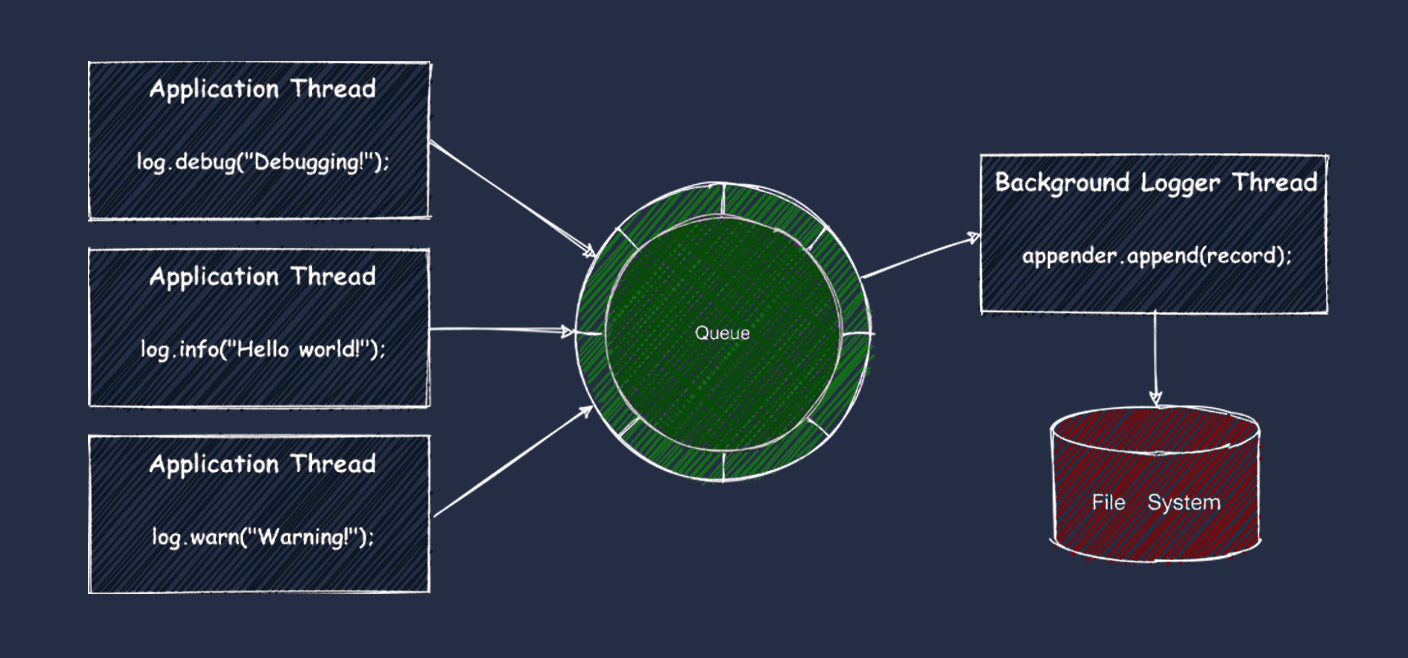
Asynchronous logger libraries usually use a queue to pass log entries from application threads to a background thread. The background thread makes log records in some format and writes or sends them to a configured storage or a service. Usually, it writes to a file or sends through a TCP or UDP connection to a downstream service (Splunk, Graylog, etc.).
One important fact about log entries is that their length depends on an application and ranges from tens to thousands of characters. Garbage-free loggers reuse the same objects and structures not to allocate new short-lived objects on each logging operation. Long log entries can bloat the objects and structures and affect performance, especially memory footprint. For example, a log message with the text representation of a large data structure could be lengthy, while some might be a few words long. So, that is one of the main concerns when you are developing a garbage-free logger. You want to have a balance between allocated memory and really used. Also, excessive object pooling has a negative effect on GC performance. It can appear in different ways depending on GC implementation. Usually, it tends to increase the execution time of blocking “stop-the-world” garbage collection events and CPU utilization of concurrent garbage collection events.
Let us take a tour of Log4j 2.14.0 and Gflog 3.0.1 libraries and see how they are different.
Log4j
Log4j is a well-known logging library. It supports a lot of features, including garbage-free mode, in which we are interested. Here is a sample ofLog4j API. All magic happens inside of a single call.
Log4j API
log.info("Hello there: {}", message);
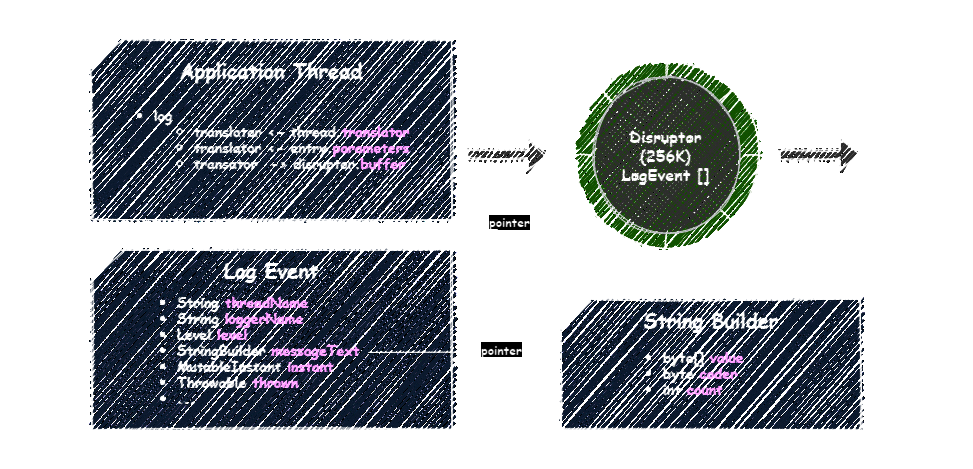
Log4j uses Disruptor to pass log entries to the background thread. Disruptor has a fixed-capacity object-oriented ring buffer and supports consumer topology. In Log4j’s case, the ring buffer is allocated with reusable log events, and the consumer is the background thread that processes them.
Log4j architecture:

Log4j allocates a Disruptor instance with 256K slots, assuming the configuration used in performance testing by Log4j’s team. Each slot represents a reusable log event and contains logger name, thread name, level, message, and other information. A message text instance is allocated lazily on the first use with the initial length equal to 128, controlled by log4j.initialReusableMsgSize system property.
When you log a message, Log4j takes a thread-local translator, fills it with the log entry parameters, and calls Disruptor#publish method. There it claims a slot, copies all references into the slot, and formats the message in the slot’s reusable StringBuilder instance. Then it makes the slot available to the background thread to consume.
So, one repeating long message can bloat all StringBuilder instances resulting in huge memory waste. Fortunately, Log4j has log4j.maxReusableMsgSize system property, which is 518 by default, to take that under control. The background thread shrinks StringBuilder instances if they are longer than 518 to the very same length. So, in the worst case, you could have all of them to be 518 long, and longer messages will produce allocations of more than 518 bytes.
Gflog
Gflog is an asynchronous garbage-free logging library that we have been using for years in low-latency trading applications. Gflog was inspired by Gflogger library by Vladimir Dolzhenko and originally started as a fork. But the further enhancements and a new API made it into a separate project. Gflog API looks similar to Gflogger API, and yet the implementation is different.
Gflog Template API
log.info("Hello there: %s").with(message);
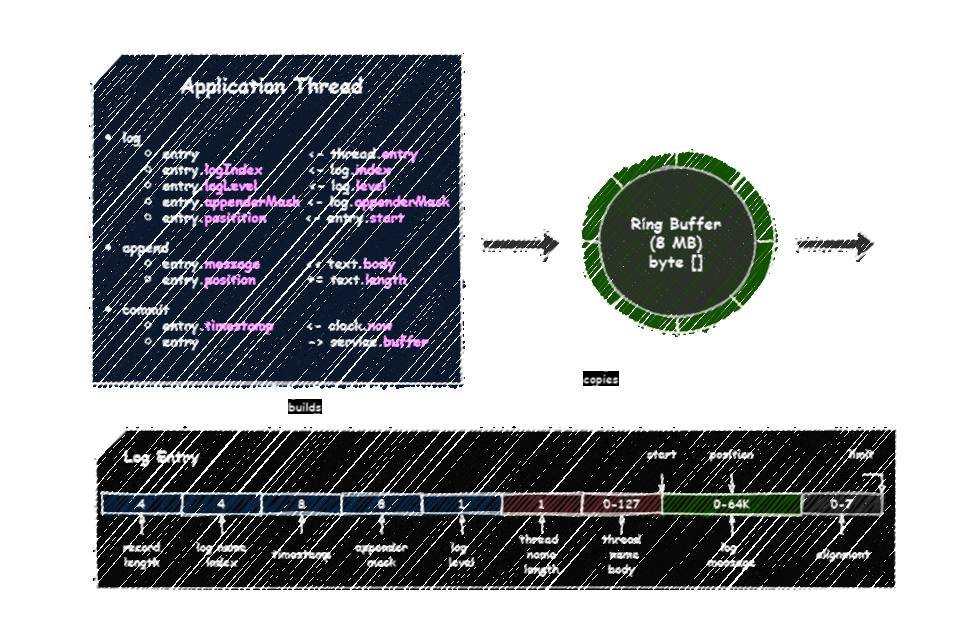
Gflog uses an off-heap byte-oriented ring buffer (an adaptation of Agrona’s ManyToOneRingBuffer) to pass log entries to the background thread. The buffer allows you to write variable-length byte messages adding a small alignment overhead 0-7 bytes. Unfortunately, you cannot pass references. But that is not a big deal. Gflog does not support capturing caller location, so the only thing which requires an exception path is exceptions. All required information, such as logger name, thread name, timestamp, can be efficiently serialized.
Gflog architecture:

Let us look at the lifecycle of log entries used by an application thread.
On the first logging operation, the thread creates a thread-local log entry. The thread name is captured and stored in the red area and not updated in the future. The same instance of the log entry is reused in the following calls.
On each logging operation, the thread updates the blue and green areas. The blue area is fixed. All fields are primitives and can be updated in any order because they have fixed lengths and offsets. Note that a logger name is stored in an index, so only the 4-byte index value needs to be passed and used to retrieve the logger name in the background thread. The green area is variable-length. The thread fills it in append fashion while building a log message.
On committing a log entry, the thread claims almost the same space for the entry in the ring buffer, copies the entry content, and makes it available for the background thread to consume.
A log entry is initialized with 4 KB and can grow up to 64 KB, depending on the configuration. Longer log messages are truncated. Gflog does not ever shrink log entries. So, in the worst case, you could have 64 KB per application thread if you logged at least one long message in each of them. Garbage is produced only when a log entry is expanded.
A log entry with an exception goes through a bit different path. The exception is passed by reference through an exception index. The background thread uses its log entry to rebuild the content with the exception details - the message and the stack trace. So that exceptions bloat only the log entry of the background thread.
Experiment Time
Okay, let us do an experiment that will compare the memory footprint of these two libraries.
We will use JOL (Java Object Layout) library to estimate memory footprint. We will inspect the object reachability graph from a logger instance after logging 1/1M/10M/100M messages with the following random distribution:
- 50% - a message with a length from 0 to 100
- 20% - a message with a length from 0 to 200
- 10% - a message with a length from 0 to 300
- 10% - a message with a length from 0 to 400
- 9% - a message with a length from 0 to 500
- 1% - a message with a length from 0 to 1000
We will use Java 11 with the following JVM options:
- -Xms1g – initial heap size
- -Xmx1g – max heap size
You can check out the code:
Note that JOL does not count off-heap memory and static roots. We will take it into account for Gflog.
Let us log a message in Gflog.
| Instances | Footprint/Instances (bytes) | Footprint (bytes) | Type |
|---|---|---|---|
| 3512 | 200 | 702416 | byte[] |
| 2443 | 36 | 88256 | java.lang.Object[] |
| 3390 | 24 | 81360 | java.lang.String |
| 2338 | 32 | 74816 | java.lang.invoke.LambdaForm$Name |
| 148 | 504 | 74624 | int[] |
| 24960 | - | 1654232 | (total) |
We see only 1.58 MB. We need to add at least 8 MB to account for the off-heap ring buffer. Let us add 2 MB in reserve. So, the actual result is 11.58 MB. The heaviest structure is the buffer.
Now we log a message in Log4j.
| Instances | Footprint/Instances (bytes) | Footprint (bytes) | Type |
|---|---|---|---|
| 262144 | 104 | 27262976 | org.apache.logging.log4j.core.async.RingBufferLogEvent |
| 262143 | 32 | 8388576 | org.apache.logging.log4j.util.SortedArrayStringMap |
| 262144 | 24 | 6291456 | org.apache.logging.log4j.core.time.MutableInstant |
| 437 | 2583 | 1128808 | int[] |
| 601 | 1812 | 1089336 | java.lang.Object[] |
| 5486 | 148 | 816392 | byte[] |
| 5331 | 24 | 127944 | java.lang.String |
| 815846 | - | 45866000 | (total) |
We see 43.75 MB just allocated to keep reusable objects. And note that StringBuilder instances for messages are not yet allocated except for one.
Okay, let us log a million messages in Gflog.
| Instances | Footprint/Instances (bytes) | Footprint (bytes) | Type |
|---|---|---|---|
| 3738 | 190 | 710792 | byte[] |
| 1235 | 72 | 88920 | java.lang.reflect.Field |
| 2443 | 36 | 88256 | java.lang.Object[] |
| 3602 | 24 | 86448 | java.lang.String |
| 632 | 120 | 75840 | java.lang.Class |
| 25984 | - | 1702872 | (total) |
We see that the memory footprint remains nearly the same. The messages are too short for Gflog to expand the thread-local log entry.
And now we log a million messages in Log4j.
| Instances | Footprint/Instances (bytes) | Footprint (bytes) | Type |
|---|---|---|---|
| 268263 | 283 | 76023096 | byte[] |
| 262144 | 104 | 27262976 | org.apache.logging.log4j.core.async.RingBufferLogEvent |
| 262745 | 60 | 15769368 | java.lang.Object[] |
| 262144 | 24 | 6291456 | java.lang.StringBuilder |
| 262144 | 24 | 6291456 | org.apache.logging.log4j.core.time.MutableInstant |
| 452 | 2497 | 1129048 | int[] |
| 5958 | 24 | 142992 | java.lang.String |
| 1342827 | - | 133755584 | (total) |
Now it takes 127.56 MB, and we see 256K StringBuilder instances. The average size is around 283 B, meaning that some instances still can expand.
Let us continue logging up to 10/100 million messages.
We see that Gflog’s footprint is steady. On the other hand, Log4j takes more and more space because StringBuilder instances expand. Eventually, all of them hit the limit.
Let us try Java 8. Maybe we find out something different.
Indeed, Log4j takes almost 1.7x more space in Java 8. Why? Because of the Compact Strings feature introduced in Java 9. So StringBuilder instances take x2 less space if you log only Latin-1 messages. But they still can be inflated if sometimes you log not Latin-1 messages and remain like that.
Okay, what about the number of live objects? See “a million messages” case:
- Log4j – 1343 K
- Gflog – 26 K
Log4j has a lot of live objects. But how does it affect GC? Let us use System::gc method to simulate full GC collection events. We will simulate 5 warmup events and then 10 measure events in each of the points:
- Clean – before initializing a logger.
- Initialized – after initializing the logger, but before logging a message.
- Measured – after logging 100 million messages, but before destroying the logger.
- Destroyed – after destroying the logger.
The warmup events remove the garbage allocated between two points. The measure events show the overhead of the reusable live objects when a full GC collection event occurs.
G1 GC is the default garbage collector in Java 11.
Parallel GC is the default garbage collector in Java 8.
We can see that excessive object pooling, as well as producing garbage, hits GC performance. It sounds like a paradox, but we can still minimize both. So, the fewer objects we have, the less work a garbage collector needs to do.
Conclusion
In the asynchronous garbage-free context, you usually pass data by value - you copy data into a queue/buffer, and then you make it available for consumption. Here you can choose an object-oriented queue or a byte-oriented queue. The first one allows you to pass object references but can also waste a lot of memory, especially when the data is polymorphic or variable-length. The second one does not allow you to pass object references directly but provides efficient memory management.
As you can see, a byte-oriented queue decreases memory footprint by order of magnitude as well as the number of live objects a JVM has to manage.
In the next article, we will find out how a byte-oriented queue can improve performance.
This research paper has been created by Artsiom Korzun a member of the EMBER Server team.


 Artsiom Korzun


