

 Barys Chupryn
Measuring WebSocket Data Feed Latency

Overview
Note: visit Ember website to read the full original article.
This document outlines a method for measuring network latency in a WebSocket-based market data feed, using the BINANCE exchange as an example.
By intercepting network packets and comparing their as-captured timestamps with the exchange's as-emitted timestamps, we can gather statistics on market data latency. Assuming we and the exchange synchronize local clocks with a reliable source, this method enables us to gather valuable statistics about market data latency.
Given that we use the Linux LIBPCAP library to capture market data traffic, we use packet receive time (set by Linux kernel) for as-captured timestamps.
Bottom line: In this experiment, we show that the average latency of BINANCE market data in Tokyo AWS is around 4 milliseconds (99P is 13 ms).
Setup
- We use an AWS c5.2xlarge instance running in the apne1-az1 zone (Tokyo region).
- The server is running Amazon Linux 2.

Clock Sync
A Chrony service is configured to check with the 169.254.169.123 AWS NTP service every 2 seconds.
chronyc sources -v

  .-- Source mode  '^' = server, '=' = peer, '#' = local clock.
 / .- Source state '*' = current best, '+' = combined, '-' = not combined,
| /             'x' = may be in error, '~' = too variable, '?' = unusable.
||                                                 .- xxxx [ yyyy ] +/- zzzz
||      Reachability register (octal) -.           |  xxxx = adjusted offset,
||      Log2(Polling interval) --.      |          |  yyyy = measured offset,
||                                \     |          |  zzzz = estimated error.
||                                 |    |           \
MS Name/IP address         Stratum Poll Reach LastRx Last sample
===============================================================================
^* 169.254.169.123               3   1   377     2  -5688ns[-7702ns] +/-  396us
The clock error bound is approximately 0.3 milliseconds, as shown above.
Tuned Profile
The server is running using a latency-performance tuned profile.
TLS Decryption
Binance WebSocket market data traffic is encrypted with TLS. In order to decrypt network packets that we intercept, we use a jSSLKeyLog agent.
The Deltix Aggregator has the following additional process parameter:
<AGGSERVER_OPTS=-javaagent:/sslkeylog/jSSLKeyLog.jar==/sslkeylog/sslkey.log
Experiment
There are two possible approaches to analyzing the latency numbers of network traffic:
-
Offline analysis - Traffic is first recorded into a
pcapfile with a tool liketcpdumporWireshark/tshark, and later analyzed with a combination oftshark, WebSocket data parser utility, andlatency-tool, usually on another system. Usingtcpdumphas a minimal performance cost, unless the disk i/o itself affects jitter. To minimize the file size, apply a filter to record only a single connection, rather than having all data pass through the network interface. -
Online analysis -
tshark, the WebSocket data parser utility, andlatency-toolrun and output results in real-time on the target system. This incurs a small but noticeable performance cost and consumes several processes/threads, but does not require saving data traffic into a file and avoids disk i/o. This approach is currently considered experimental and not mentioned further in this document.
The following sections describe the first approach since it is easier to reproduce.
Links to the aforementioned Deltix tools:
- WebSocket Parser helper utility
tshark-ws-parser: CentOS/AmazonLinux2 and Alpine. - Latency analysis tool
latency-tool: CentOS/AmazonLinux2 and Alpine.
Step 1: Record packet data
Start recording data before:
1. The data connector is connected to the WebSocket feed
2. The TLS decryption key is logged to sslkey.log
Remember to restart the connector(s) after starting a new recording session.
The Binance WebSocket endpoint is available at: wss://data-stream.binance.vision:9443.
Given that we need to intercept traffic coming from the port 9443, and eth0 is called on the network interface, we use the following command:
sudo tcpdump -i eth0 tcp port 9443 -w capture.pcap
Here we use the tcp port 9443 capture filter described in tcpdump man. You can check if there is any data coming through by omitting -w capture.pcap (output to file redirect) on your first attempt.
Step 2: Analyze recorded packet data
In order to decrypt TLS traffic, use the tshark tool.
Follow these steps:
1. Install tshark on Linux using a package manager or building it from sources if the package version is too old. Note that tshark versions prior to 2.0 lack WebSocket protocol support. Amazon Linux 2 provides version 1.10. You can run tshark in a container as a workaround.
2. Ensure you have capture.pcap and sslkey.log in the current directory, and the latency analysis binaries in ./bin subdirectory.
3. Run the following command:
tshark -r capture.pcap -o tls.keylog_file:/home/ec2-user/sslkeylog/sslkey.log -Y "websocket.payload" -o gui.column.format:"Time","%t" -t e -P -x -l | ~/latency-tool/tshark-ws-parser | ~/latency-tool/latency-tool -d`
Alternatively, you can run tshark in a container using the following command:
docker run --rm -v $(pwd)/capture.pcap:/data/capture.pcap -v /home/ec2-user/sslkeylog/sslkey.log:/sslkeylog/sslkey.log cincan/tshark -r /data/capture.pcap -o tls.keylog_file:/sslkeylog/sslkey.log -Y "websocket.payload" -o gui.column.format:"Time","%t" -t e -P -x -l | ~/latency-tool/tshark-ws-parser | ~/latency-tool/latency-tool -d
Results
Here are the results for the BTC/USDT feed latency measured on June 8th, 2023, between 15:00 and 16:00 NY:
--------   Latency IN -> OUT   --------
Percentile : Microseconds : Event count
MIN        :       1125.0 :           1
50.0%      :       3967.0 :       25042
90.0%      :       5315.0 :       45052
99.0%      :      13097.0 :       49574
99.9%      :      15925.0 :       50004
99.99%     :      18459.0 :       50053
99.999%    :      18459.0 :       50053
99.9999%   :      19037.0 :       50054
99.99999%  :      19037.0 :       50054
99.999999% :      19037.0 :       50054
MAX, TOTAL :      19037.0 :       50054
Here are the results measured on June 9th:
--------   Latency IN -> OUT   --------
Percentile : Microseconds : Event count
MIN        :       1180.0 :           1
50.0%      :       3942.0 :       39532
90.0%      :       5585.0 :       71125
99.0%      :      11523.0 :       78238
99.9%      :      24362.0 :       78951
99.99%     :      26446.0 :       79025
99.999%    :      26446.0 :       79025
99.9999%   :      26446.0 :       79025
99.99999%  :      26446.0 :       79025
99.999999% :      26446.0 :       79025
MAX, TOTAL :      26446.0 :       79025
HDR Histogram Report
You can obtain a report in HDR Histogram format by appending: --hdr=report.hdr.
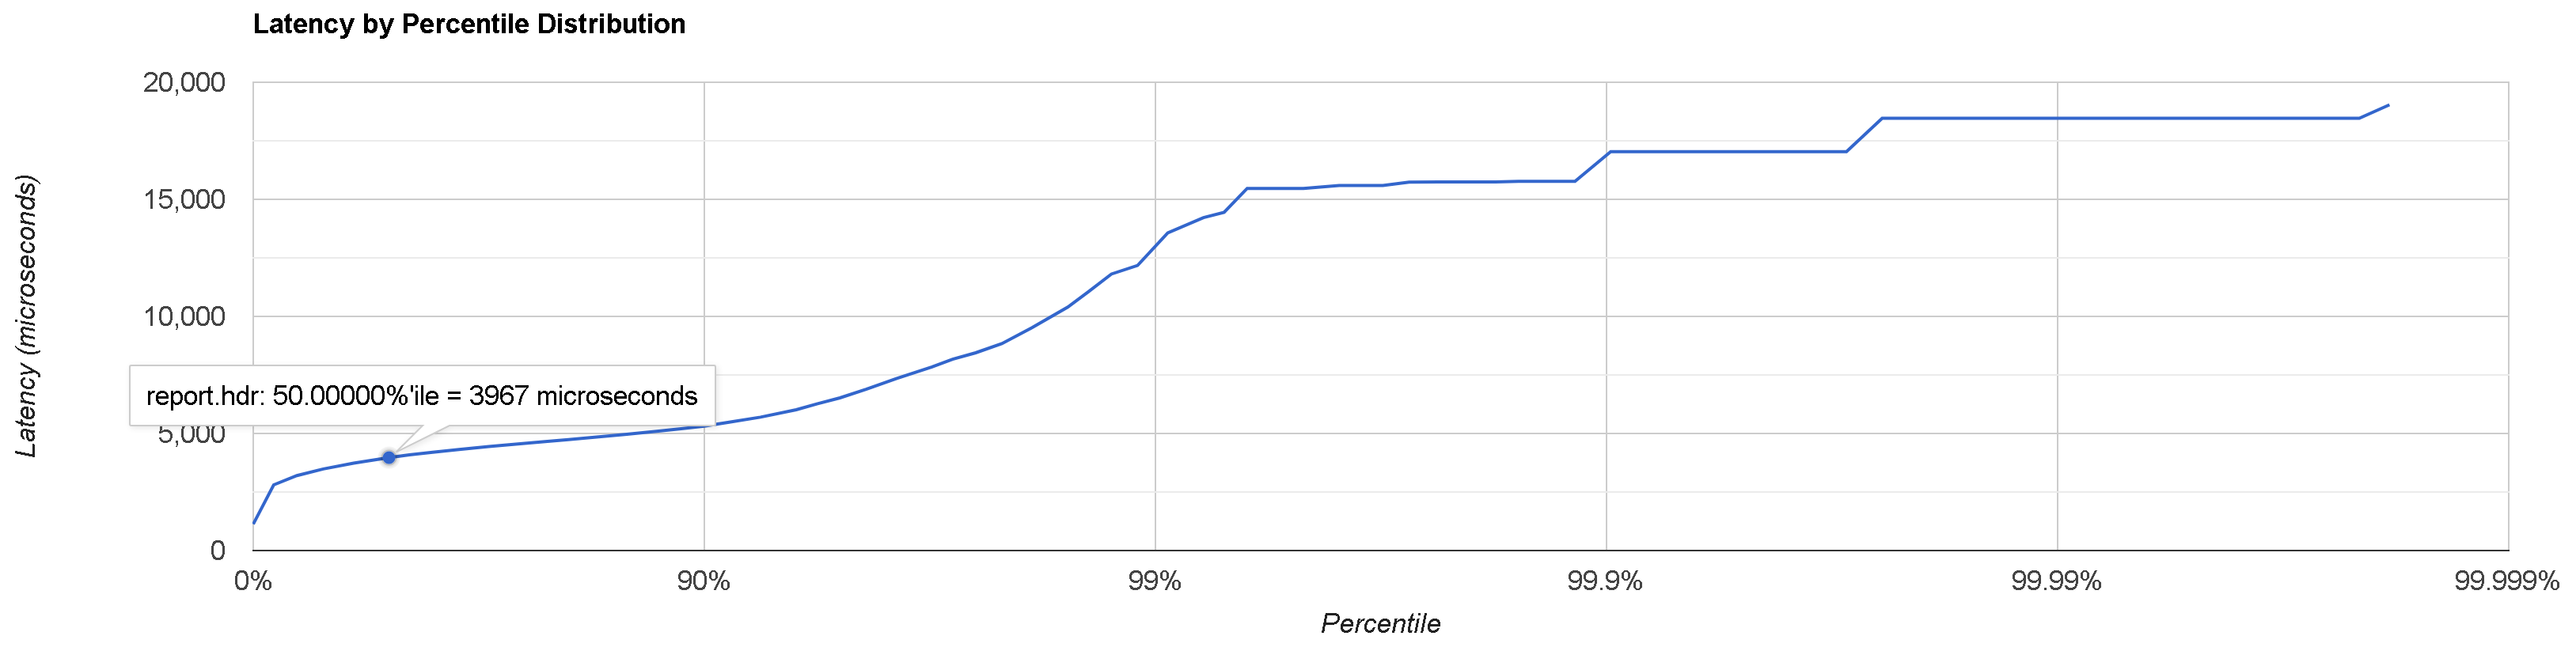
An HDR Histogram plotter can be found on Gil Tene's site.
If the report does not print, check the troubleshooting section below.
Troubleshooting
To verify if you have captured useful WebSocket data, ensure that you have capture.pcap and sslkey.log files in the current directory and run the following command:
tshark -r capture.pcap -o tls.keylog_file:sslkey.log -Y websocket.payload
If you can see lines containing WebSocket Text, then everything is ok. Your data can be analyzed as long as it comes from a supported provider. Use the following command to display readable payload text (assuming WS port == 9443):
tshark -r capture.pcap -o tls.keylog_file:sslkey.log -Y "tcp.port == 9443 && websocket.payload" -T fields -e frame.time_epoch -e text
If you are unable to see any WebSocket Text lines, try the following command:
tshark -r capture.pcap -Y tls
If you can now see lines containing TLS and Application Data but no WebSocket Text, it means that tshark was unable to decrypt the TLS stream(s).
Possible causes:
- Incorrect path to
sslkey.log, the file being absent or empty. Note thattsharkdoes not report an error if it was unable to find or open this file. sslkey.logdoes not contain proper keys (open the file and check the timestamps), possibly because thepcaprecording did not start before the connection was established. Ensure you starttcpdumpbefore the client connects to the WebSocket feed.
If you still can't see any output from tshark, it is likely you did not record any useful data to the pcap file due to an incorrect port/IP filter or the wrong network interface selected in your tcpdump command line. Check the size of the pcap file. Try opening it in Wireshark, and verify that your tcpdump command line is correct.
If you could obtain the WebSocket payload text, (as described at the beginning of the section), but not the latency histogram report, try omitting | bin/latency-tool -d from the command line. The normal output of tshark-ws-parser looks like this:
1670944829409000000 1670944840985197000
1670944840441000000 1670944840985197000
1670944831356000000 1670944841051799000
...
If you do not see such output, possible causes include:
- The data feed format is unsupported.
- The format wasn't autodetected correctly.
- There is currently no usable data and the feed is idling.
Appendix: Running an experiment in 3 different AZs
We conducted a similar experiment in three different AWS availability zones (AZs) in the Tokyo region. The recordings of the Binance WebSocket feed were done at roughly the same time. The results show that all three AZs receive data with similar average latency, with differences falling within the error margin.
- apne1-az1:
--------   Latency IN -> OUT   --------
Percentile : Microseconds : Event count
MIN        :       1519.0 :           1
50.0%      :       3768.0 :         932
90.0%      :       6282.0 :        1679
99.0%      :      34413.0 :        1845
99.9%      :      50915.0 :        1862
99.99%     :      52348.0 :        1864
99.999%    :      52348.0 :        1864
99.9999%   :      52348.0 :        1864
99.99999%  :      52348.0 :        1864
99.999999% :      52348.0 :        1864
MAX, TOTAL :      52348.0 :        1864
- apne1-az2:
--------   Latency IN -> OUT   --------
Percentile : Microseconds : Event count
MIN        :       2064.0 :           1
50.0%      :       4568.0 :         935
90.0%      :       9687.0 :        1683
99.0%      :      39359.0 :        1850
99.9%      :      52071.0 :        1867
99.99%     :      54881.0 :        1869
99.999%    :      54881.0 :        1869
99.9999%   :      54881.0 :        1869
99.99999%  :      54881.0 :        1869
99.999999% :      54881.0 :        1869
MAX, TOTAL :      54881.0 :        1869
- apne1-az3: No compatible instance types were available.
- apne1-az4:
--------   Latency IN -> OUT   --------
Percentile : Microseconds : Event count
MIN        :       1895.0 :           1
50.0%      :       4144.0 :         957
90.0%      :       6796.0 :        1722
99.0%      :      36575.0 :        1894
99.9%      :      51448.0 :        1911
99.99%     :      53130.0 :        1913
99.999%    :      53130.0 :        1913
99.9999%   :      53130.0 :        1913
99.99999%  :      53130.0 :        1913
99.999999% :      53130.0 :        1913
MAX, TOTAL :      53130.0 :        1913
Barys Chupryn